Using machine learning to find anomalies in fieldbus networks
Here are some more detailed figures for the paper "Using machine learning to find anomalies in fieldbus networks":
Contents
Dataset 1 - Denial of Service Attack
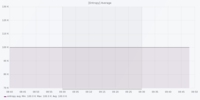
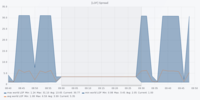
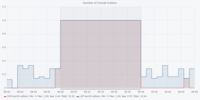
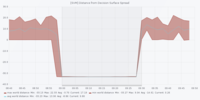
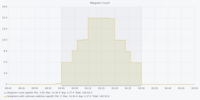
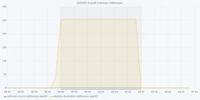
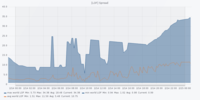
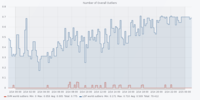
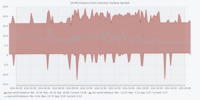
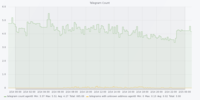
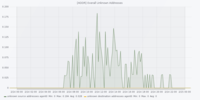
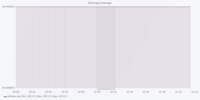
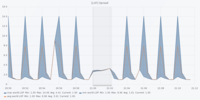
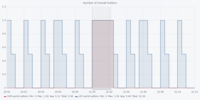
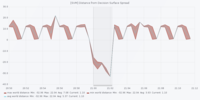
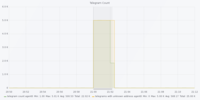
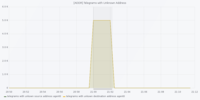
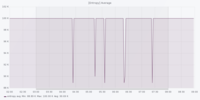
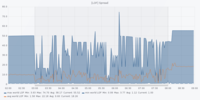
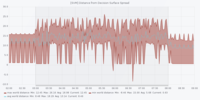
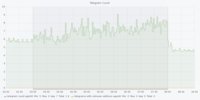
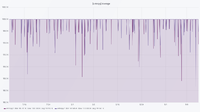
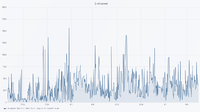
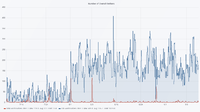
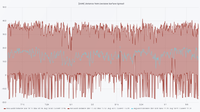
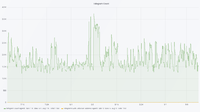
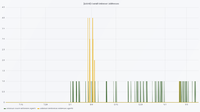
The figures are in the following order: Entropy Analyser | Local Outlier Factor Analyser | Overall Outliers | Support Vector Machine Analyser | Telegram Count | Unknown Address Analyser
Dataset 1 - New Device Attack
The figures are in the following order: Entropy Analyser | Local Outlier Factor Analyser | Overall Outliers | Support Vector Machine Analyser | Telegram Count | Unknown Address Analyser
Dataset 1 - Networkscan Attack
The figures are in the following order: Entropy Analyser | Local Outlier Factor Analyser | Overall Outliers | Support Vector Machine Analyser | Telegram Count | Unknown Address Analyser
Dataset 1 - Unusual Traffic Attack
The figures are in the following order: Entropy Analyser | Local Outlier Factor Analyser | Overall Outliers | Support Vector Machine Analyser | Telegram Count | Unknown Address Analyser
Dataset 2 - Analysers
The figures are in the following order: Entropy Analyser | Local Outlier Factor Analyser | Overall Outliers | Support Vector Machine Analyser | Telegram Count | Unknown Address Analyser
Dataset 2 - Log Analysis
In the following two pdf-files a distribution of telegrams over time (weekday and hour of the day) can be found:
File:Dataset-2-telegrams-per-hour.pdf
File:Dataset-2-telegrams-per-weekday.pdf
Licence
All figures are licensed under the Free Culture License CC BY-SA 4.0 (see [1] for more infos).
